Deriving insights into the team's overall productivity, efficiency, and performance.
Commonwealth Bank
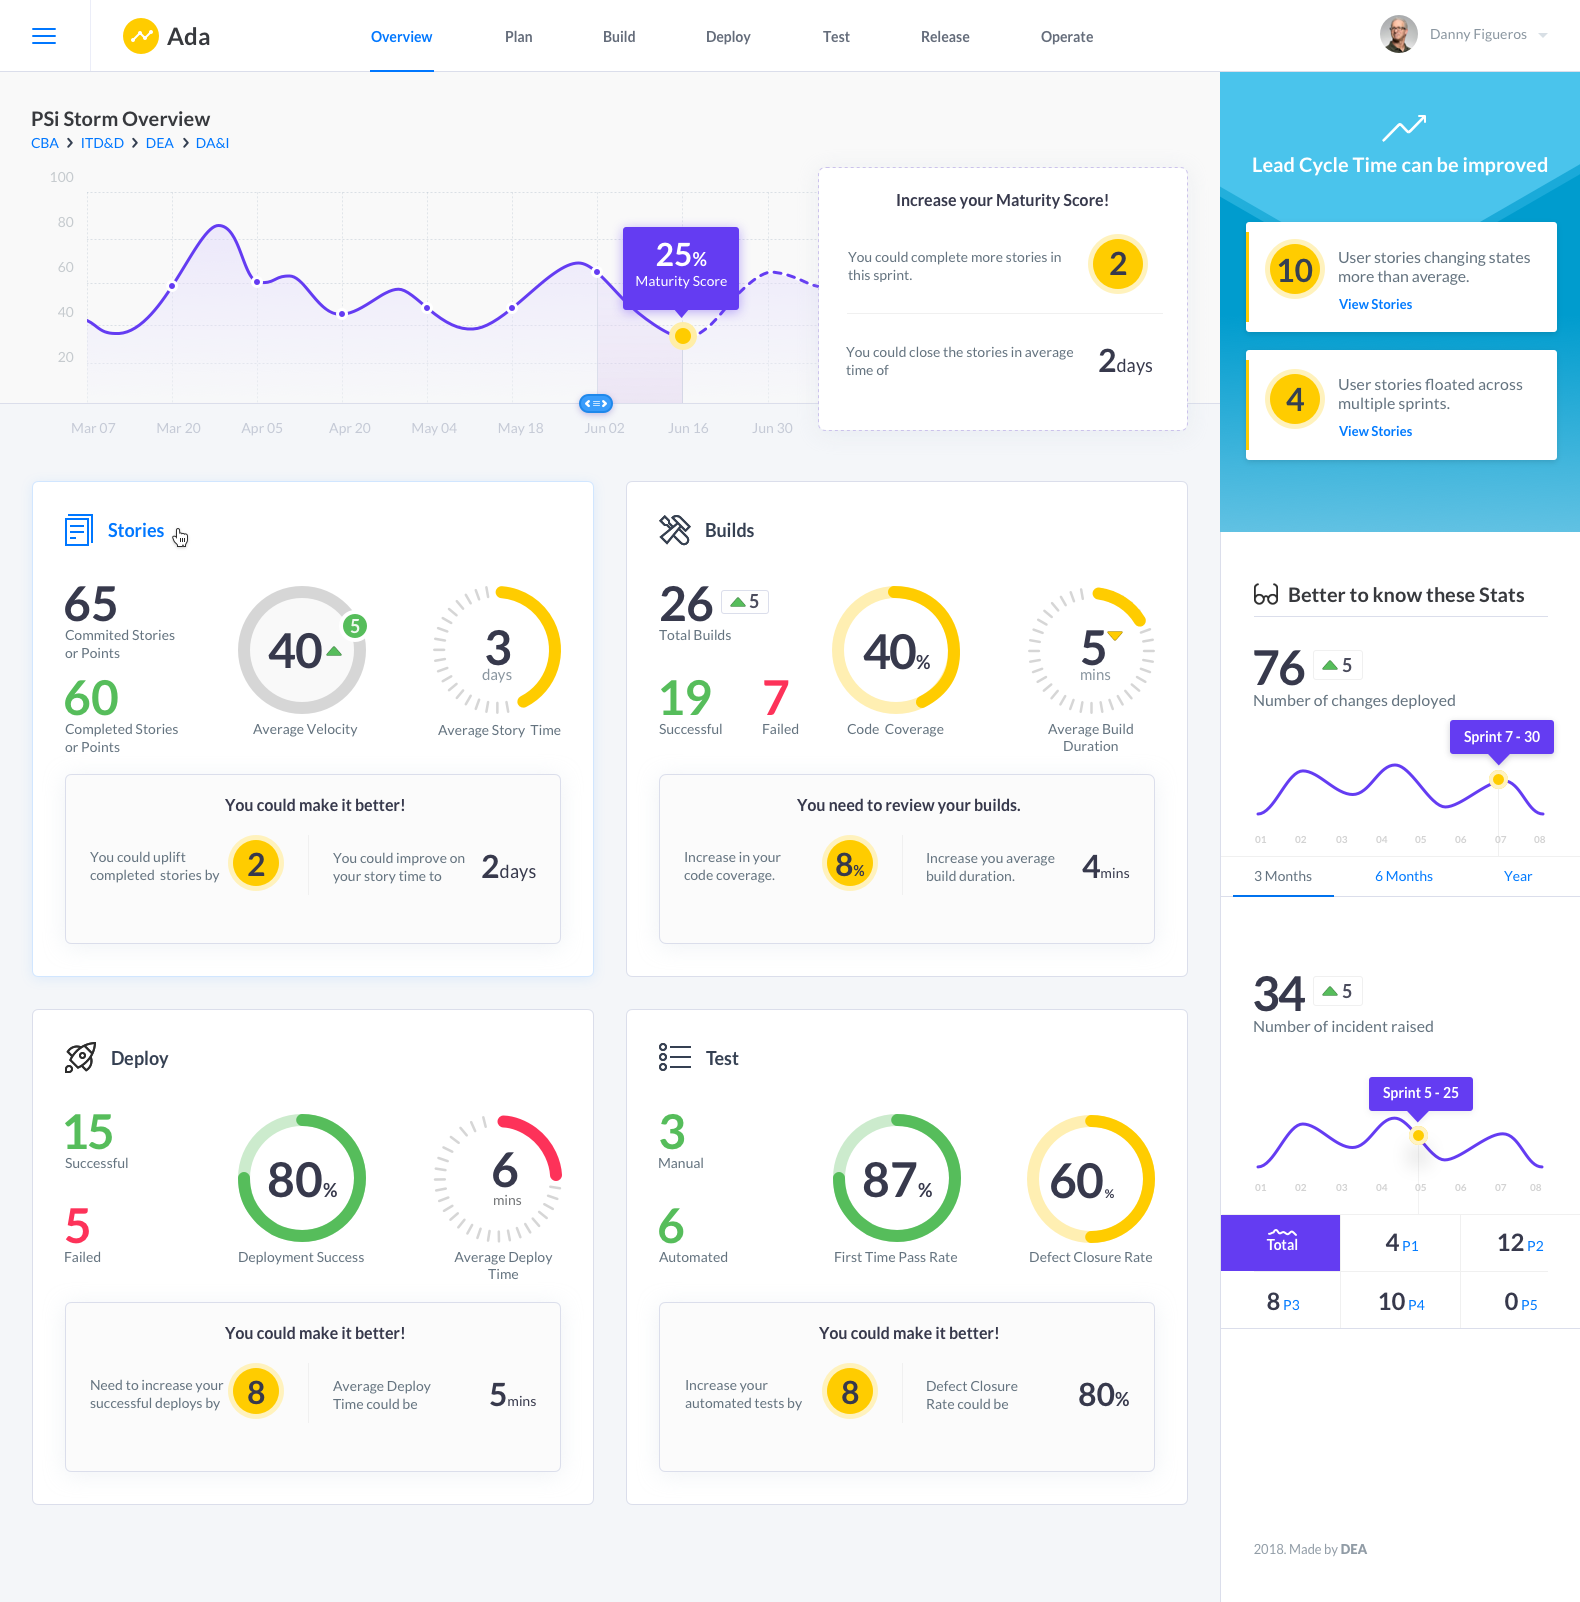
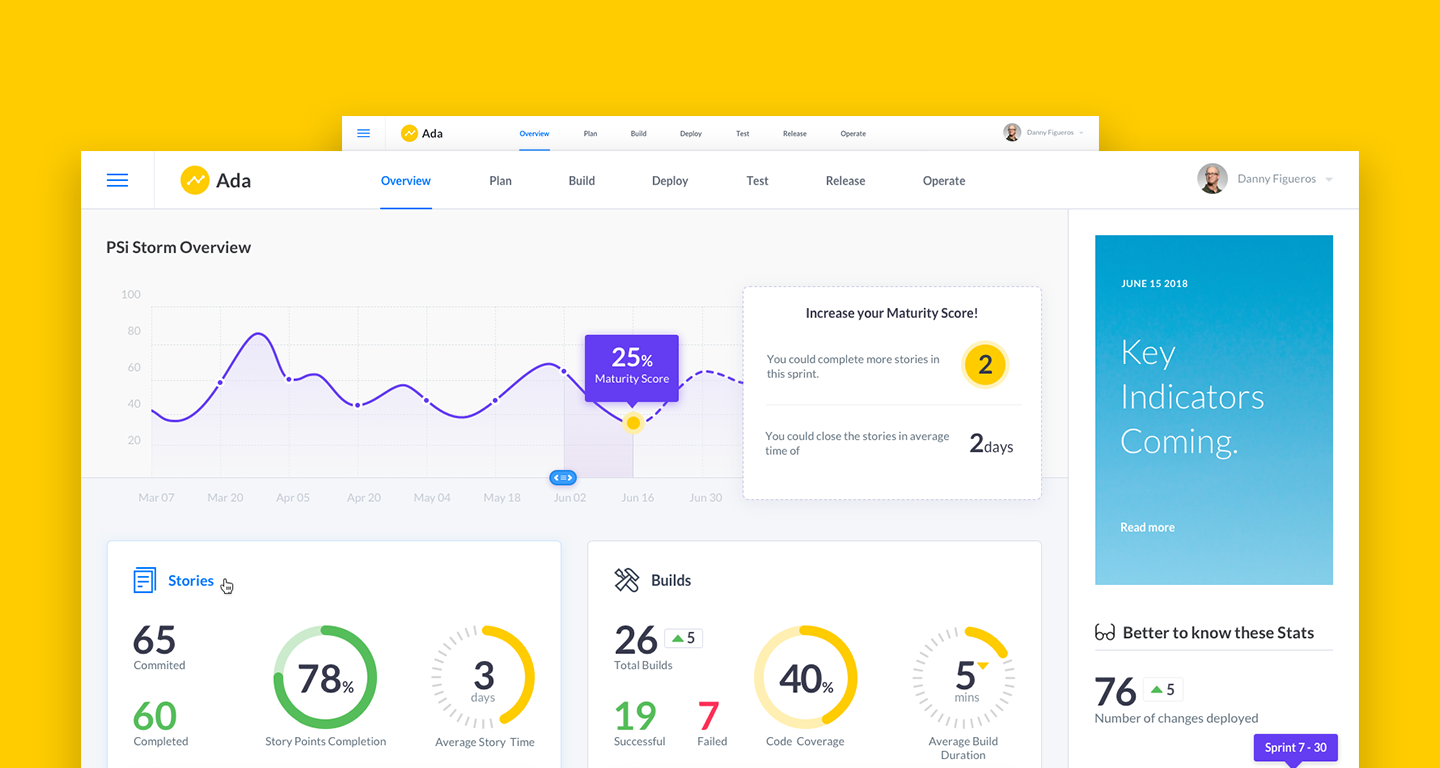
Commbank uses the customised Ada application to view key indicators for development performance. Ada transforms raw metrics into intuitive, actionable insights tailored for product owners, team leads, business stakeholders, and scrum masters.
In an era where data-driven decisions are paramount, the integration of advanced analytics tools with project management and documentation platforms like Jira and Confluence is imperative.
By leveraging these tools, we aimed to provide comprehensive insights into project timelines, team efficiency, and task management, ultimately driving productivity improvements.
Background
The initiative began with a thorough needs analysis to understand the key performance indicators that matter most to project managers and development teams. The analytics suite was then tailored to track these metrics, offering real-time dashboards and reporting features that highlight progress, bottlenecks, and areas for improvement.
The result of this integration has been a transformative shift in how performance is measured and managed. Teams can now readily identify and address inefficiencies, celebrate successes based on objective data, and foster a culture of continuous improvement.
The integration of Ada with Jira and Confluence ensures that data is not only up-to-date and accessible but also presented in context, enabling stakeholders to grasp the narrative behind the numbers. Customizable dashboards allow users to focus on the metrics that matter most to them, facilitating a personalized approach to performance management.
In deploying Ada, the goal was to shift the paradigm from reactive problem-solving to proactive performance enhancement.
Objectives
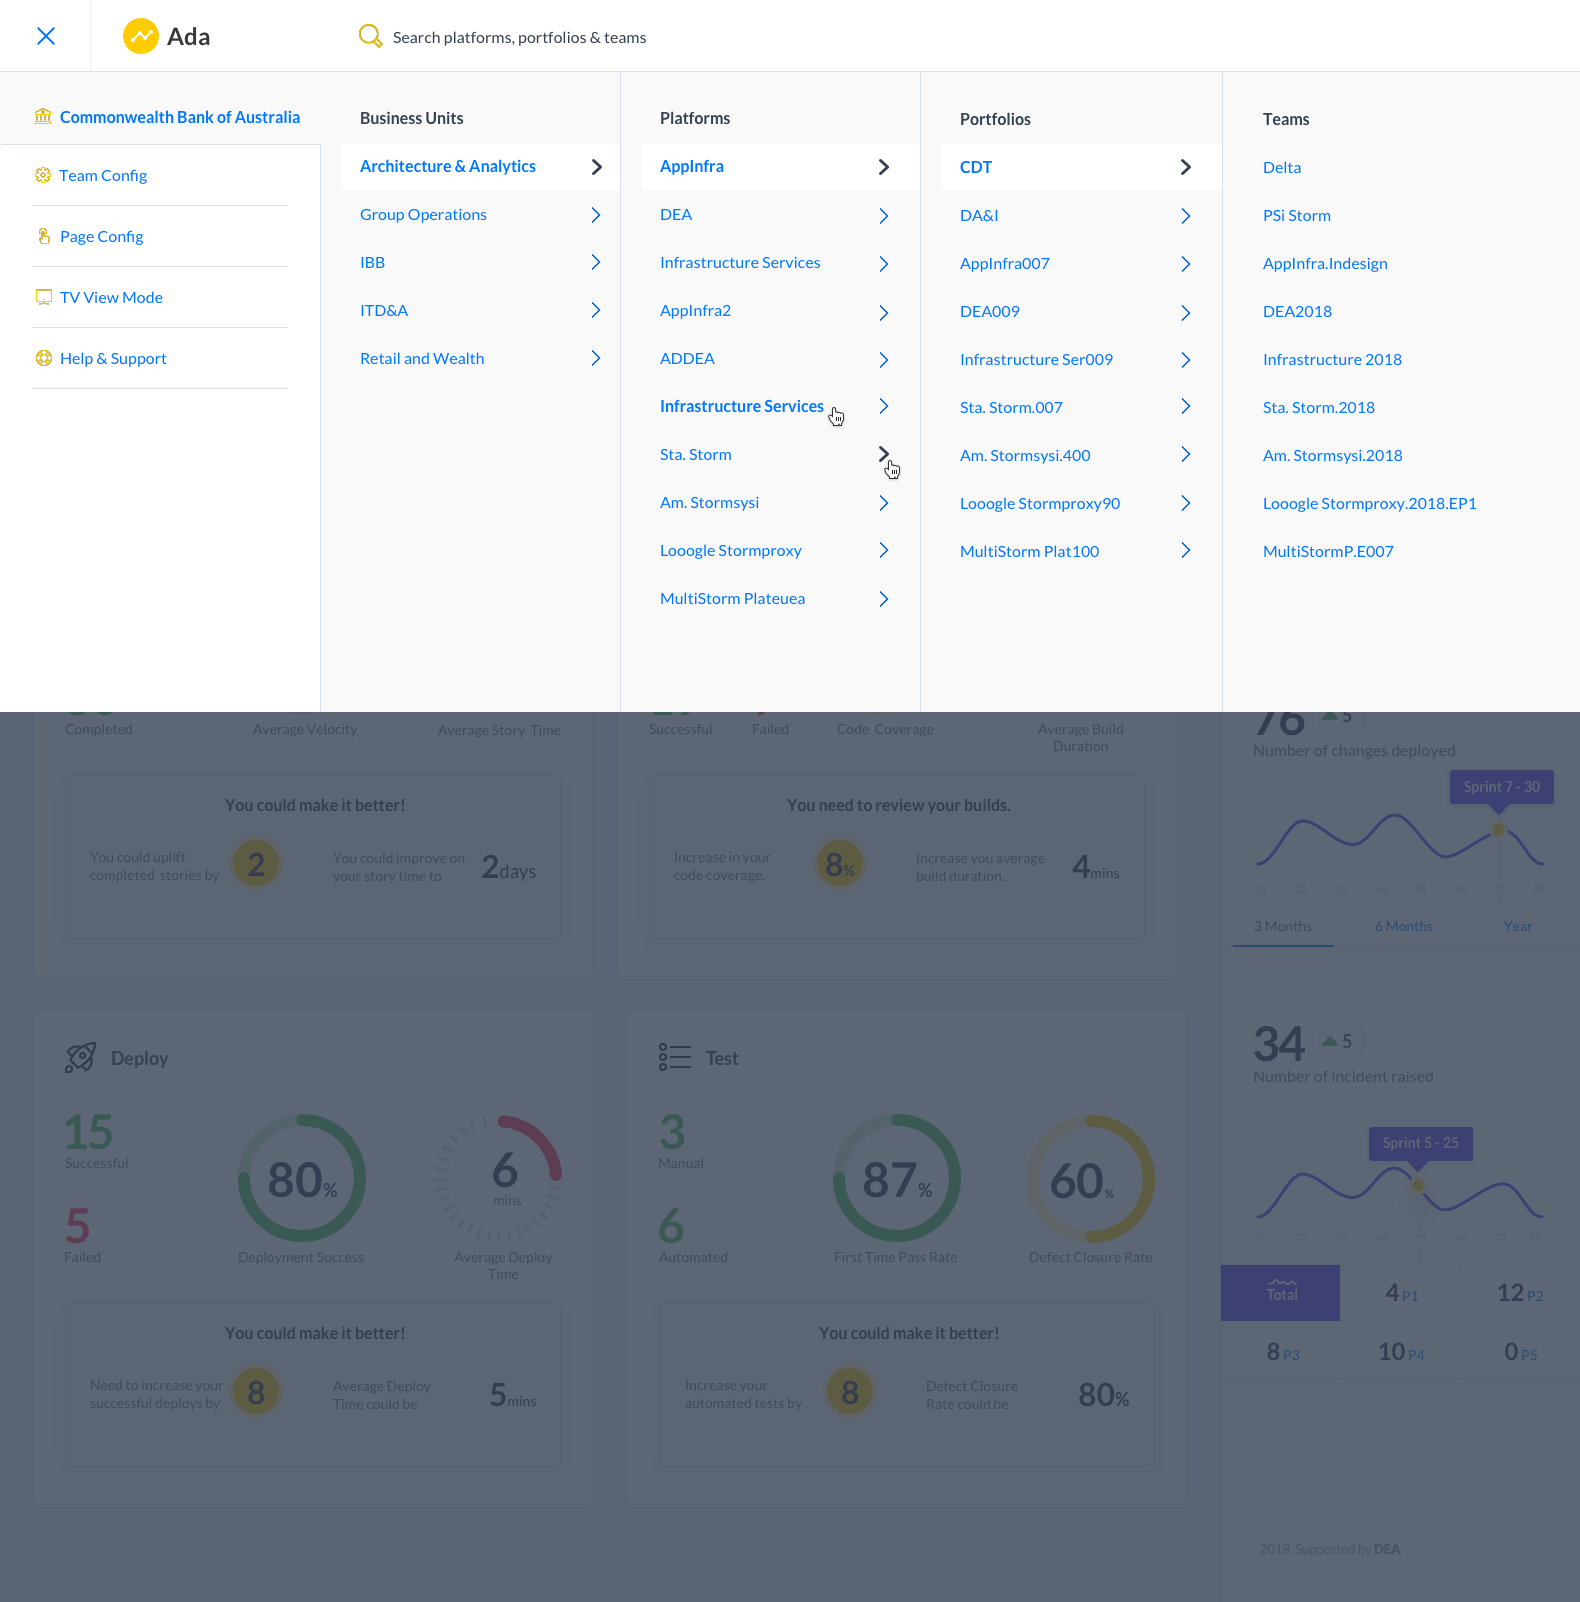
- To aggregate data from Jira and Confluence, providing a single source of truth for project metrics and progress tracking.
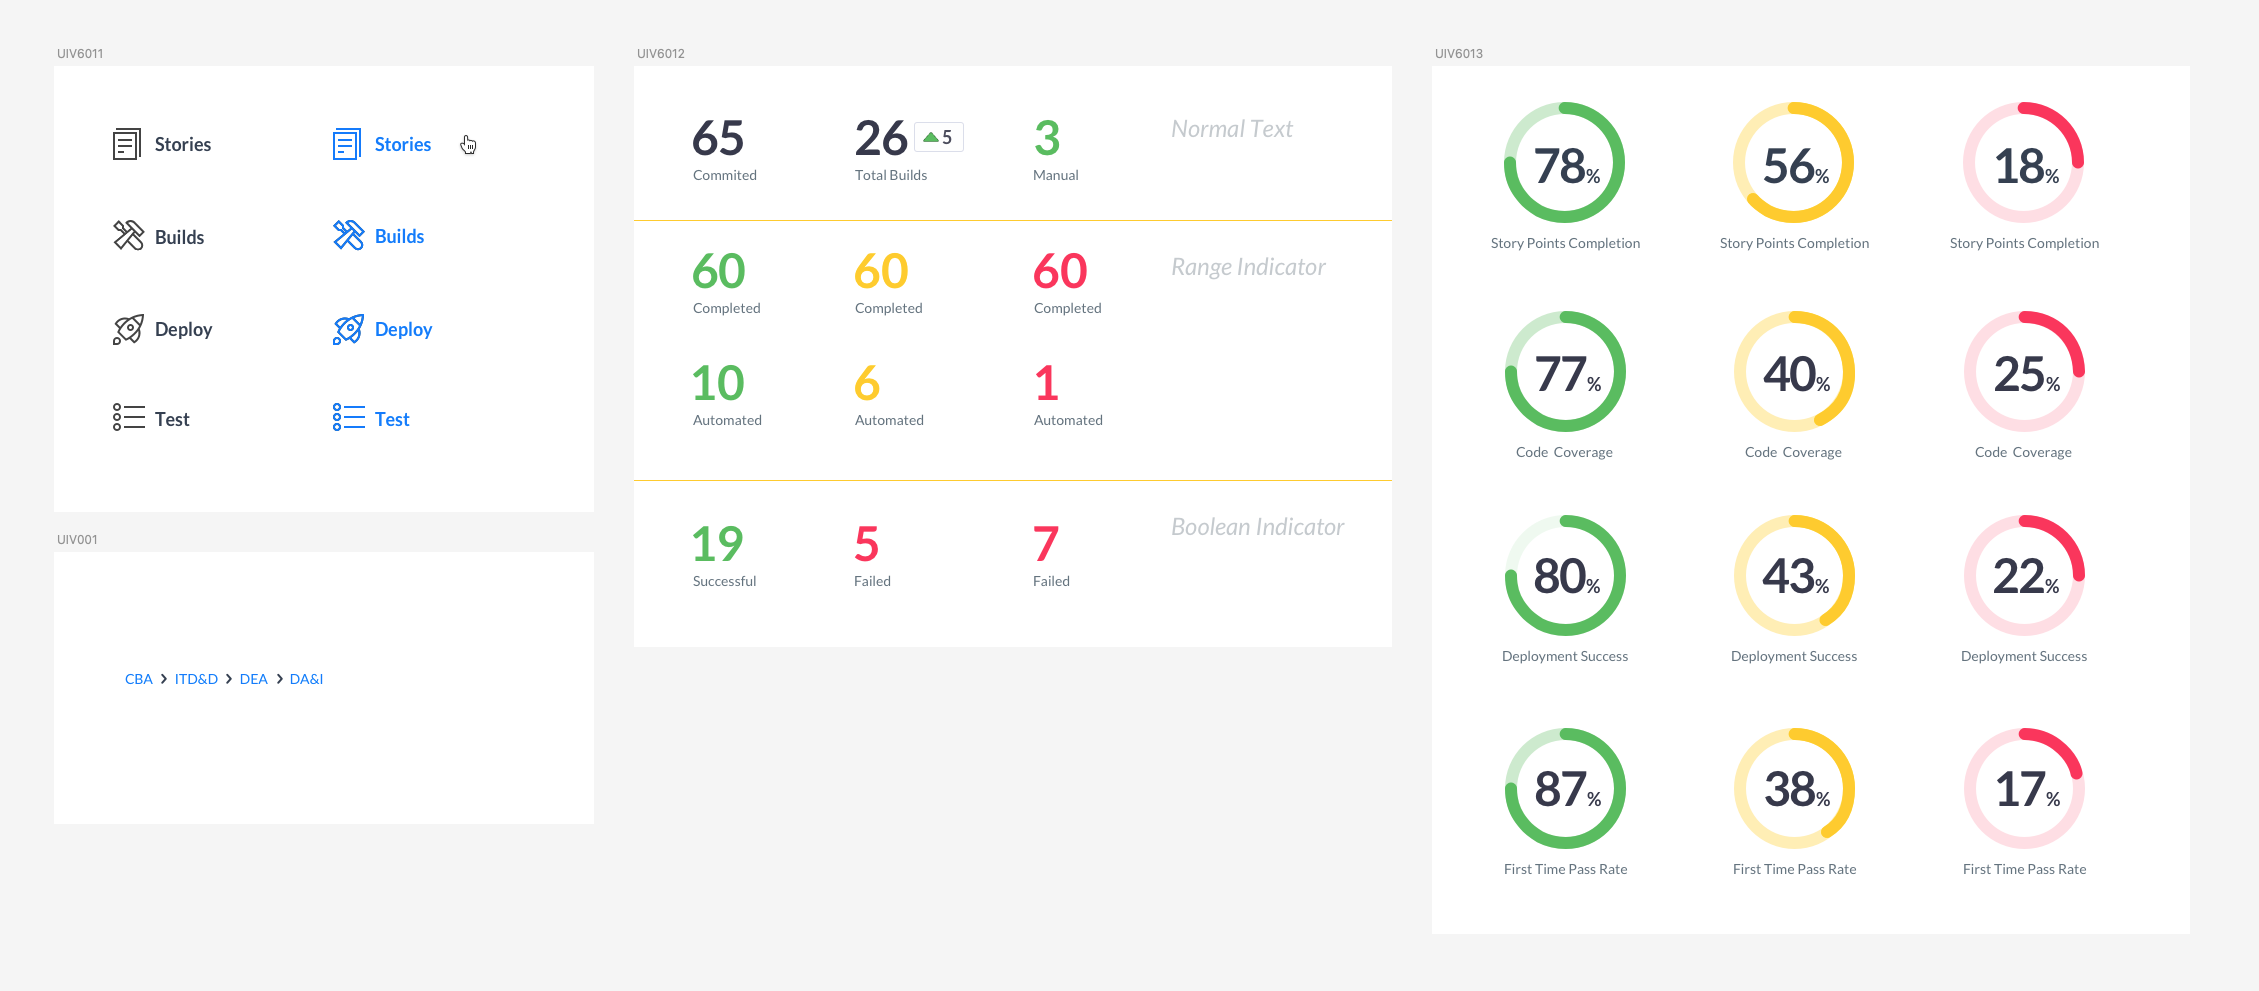
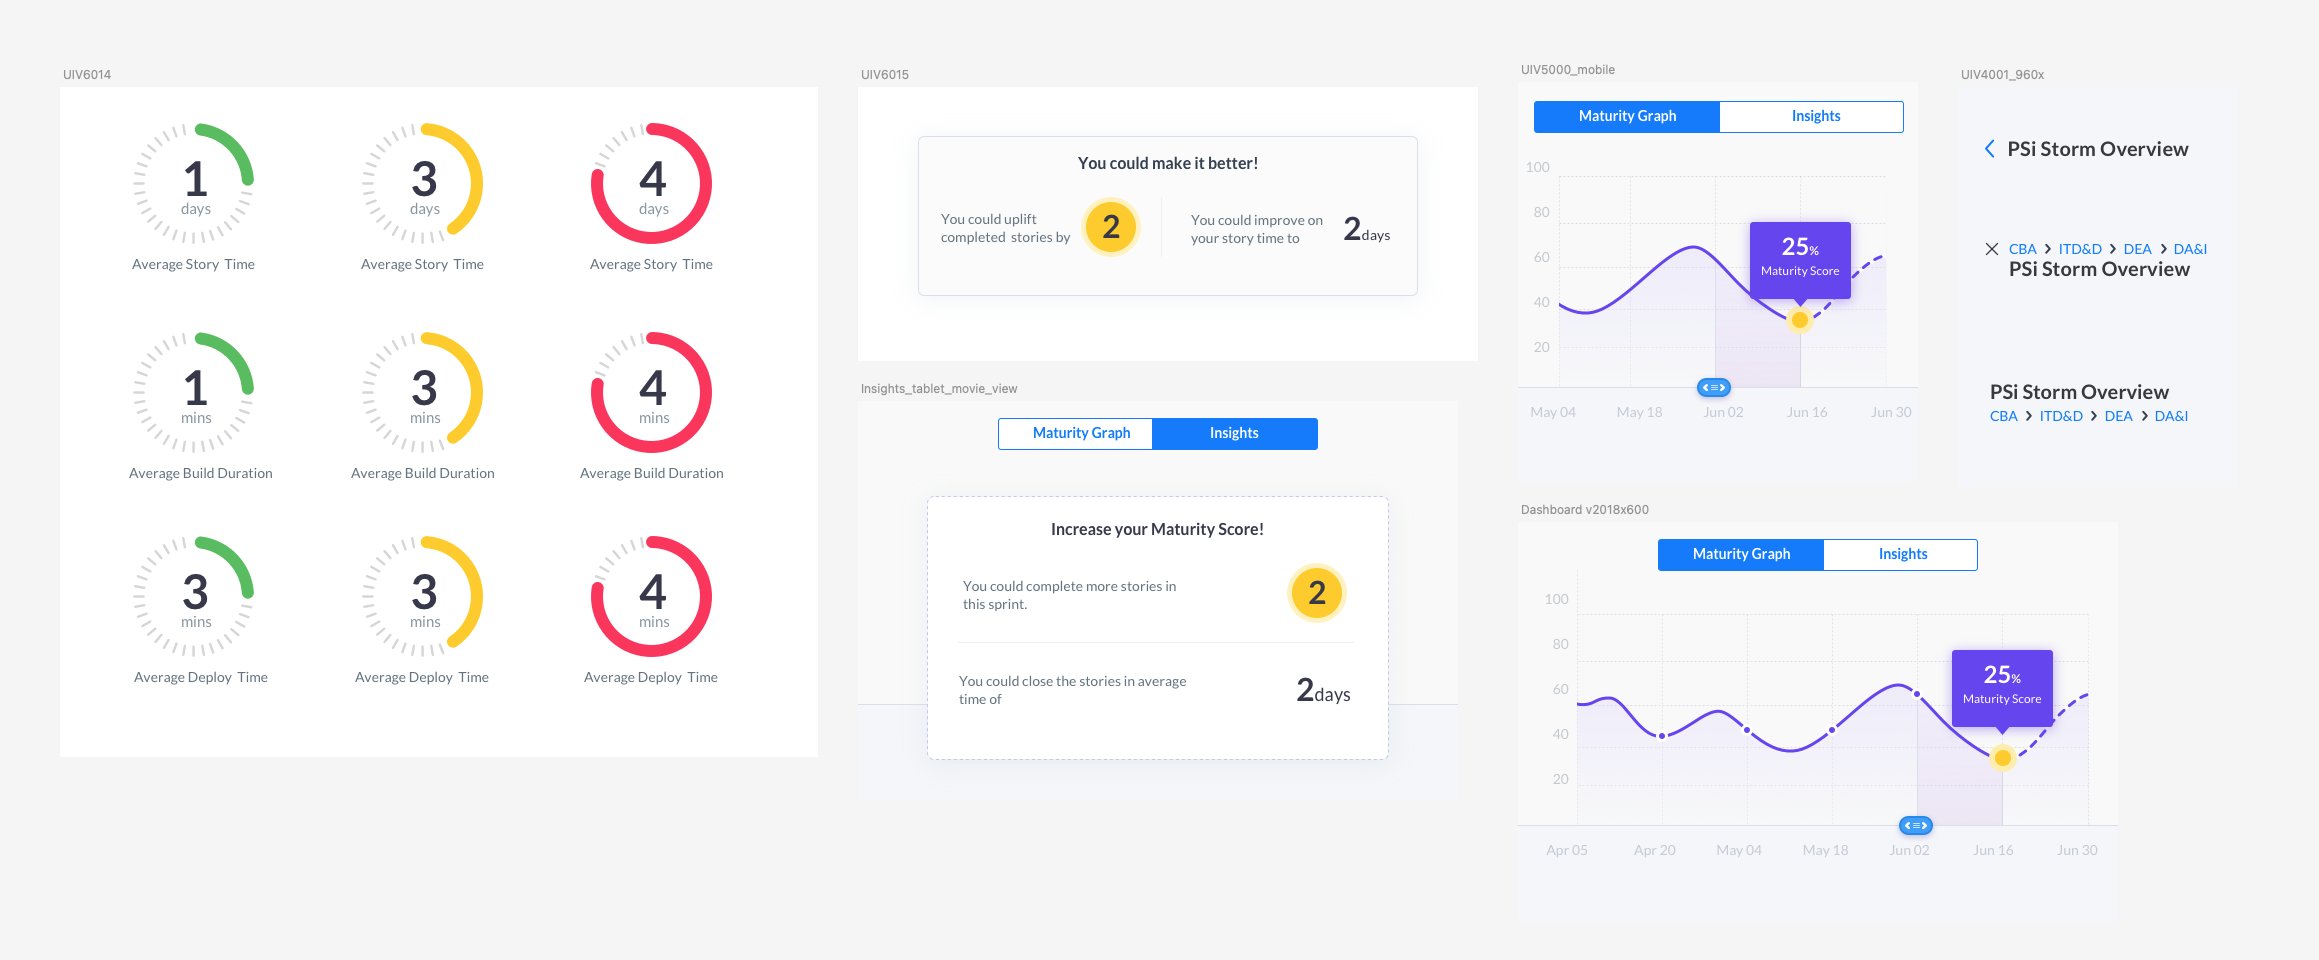
- To translate complex datasets into clear, visual formats that are easily understood by various stakeholders without the need for deep data analysis expertise.
- To identify key performance indicators (KPIs) that accurately reflect the productivity and efficiency of development teams, enabling the monitoring and fostering of continuous improvement.
- To provide stakeholders with actionable insights for swift decision-making, ensuring that strategies and adjustments are data-driven.
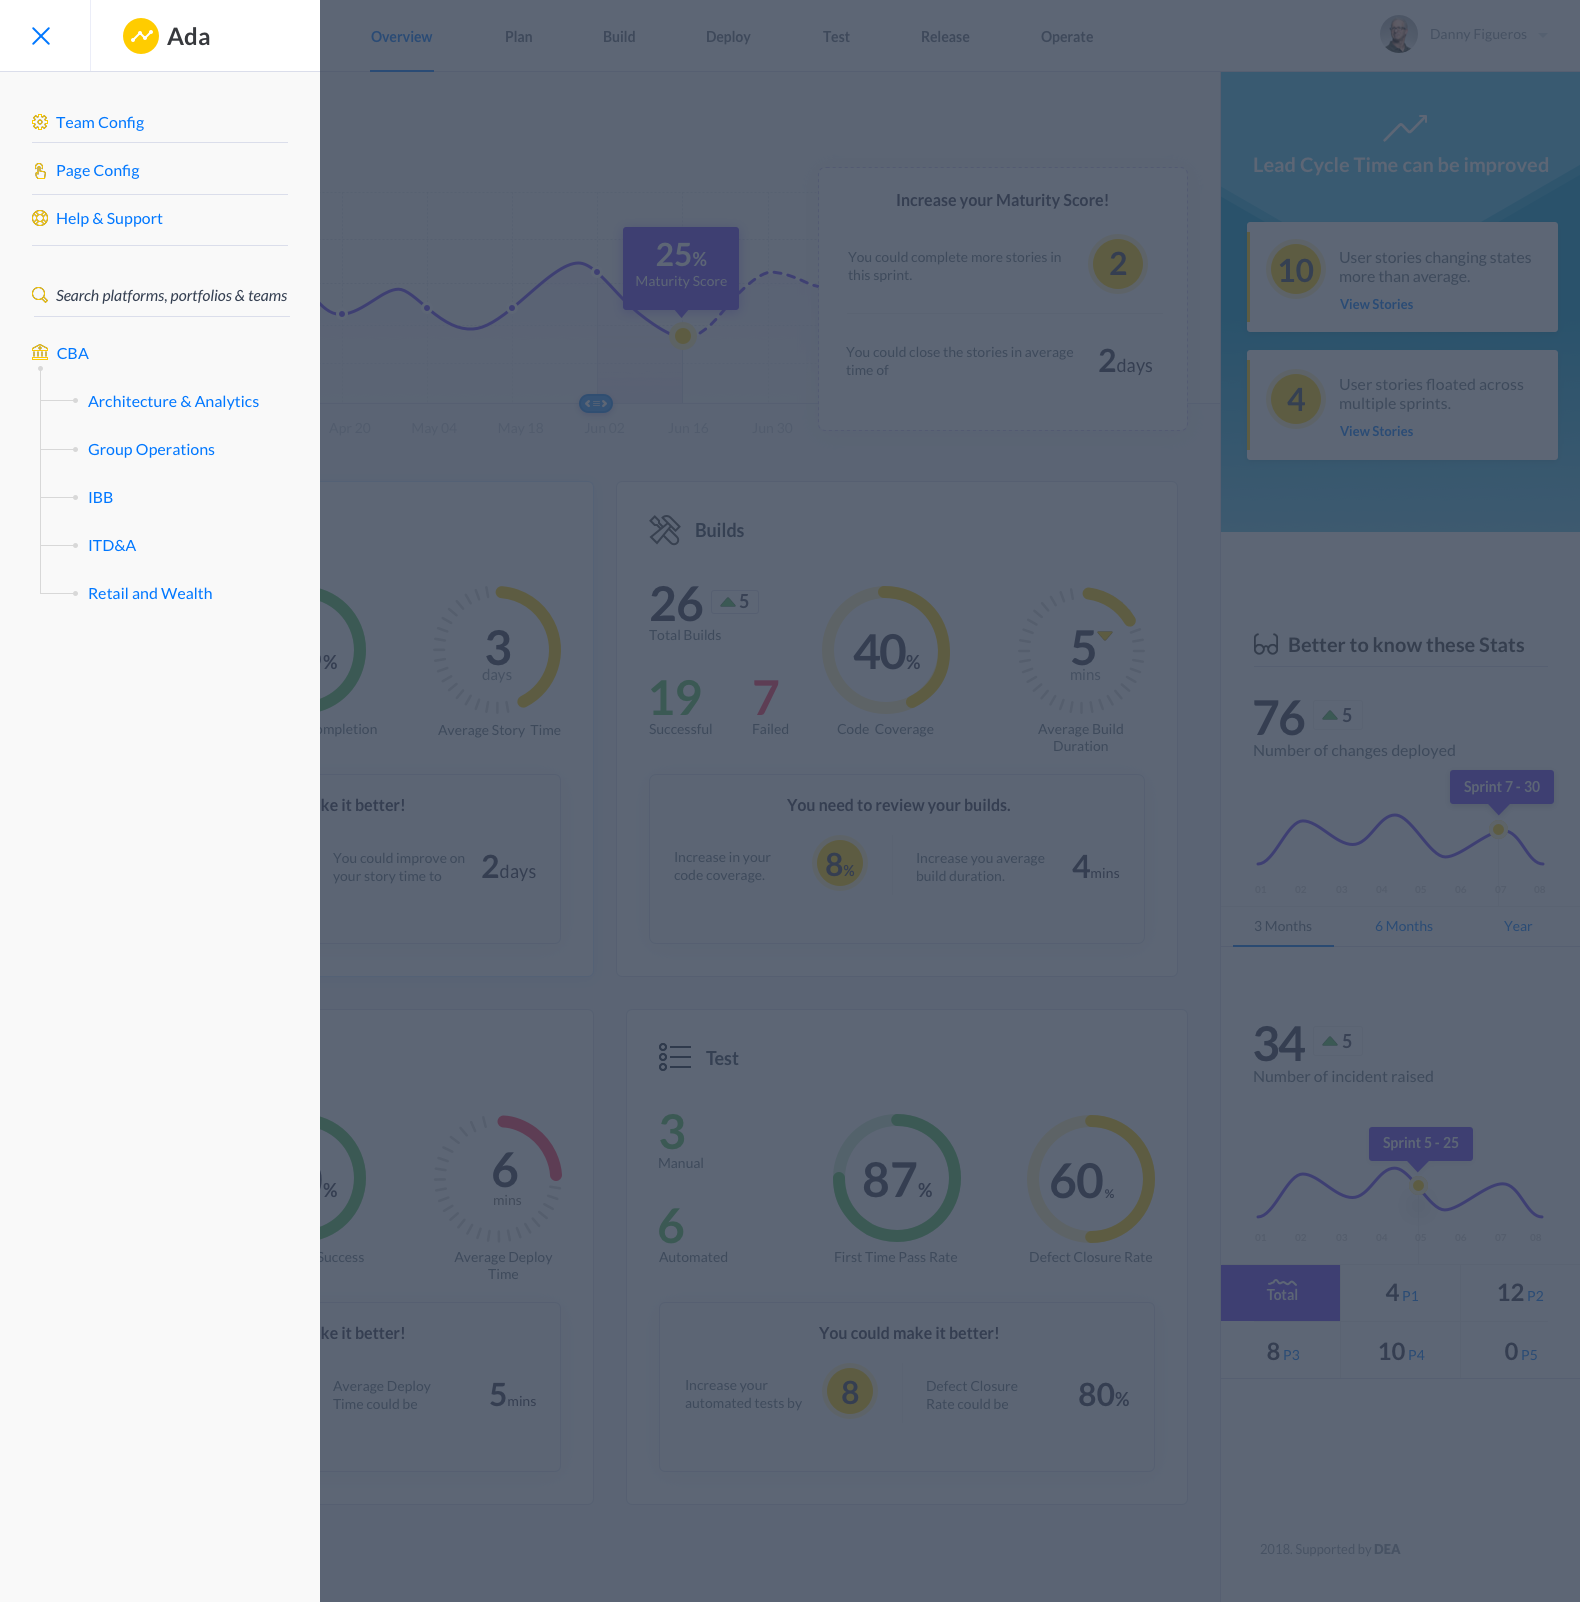
- To create a user-friendly interface that integrates seamlessly with existing workflows in Jira and Confluence, minimizing disruption and encouraging widespread adoption.
- To allow customization of dashboards and reports so that product owners, team leads, scrum masters, and business stakeholders can tailor the tool to their specific needs.
- To facilitate better communication and collaboration among teams by providing a common framework and language for discussing performance metrics.
The overarching goal of Ada is to empower teams to not only understand their current performance but also to foresee potential issues and opportunities for improvement. By setting these objectives, Ada is positioned to transform raw data into a strategic asset that drives productivity, enhances efficiency, and ultimately contributes to the delivery of successful software projects.
Research methods
- Surveys and questionnaires: Distributed to a wide range of stakeholders, including product owners, team leads, business stakeholders, and scrum masters to gather quantitative data on their experiences, expectations, and preferences regarding analytics and reporting tools.
- Interviews: Conducted one-on-one sessions with key stakeholders to gain deeper insights into their daily challenges with data interpretation and decision-making processes.
- Observational studies:Monitored how stakeholders interacted with Jira and Confluence in their natural work environment to identify common behaviors and workflows that the Ada tool would need to accommodate.
- Focus groups: Brought together diverse groups of stakeholders to discuss their needs and desires for a performance analytics tool, fostering an environment where participants could build on each other's ideas.
- Usability testing: Early prototypes of Ada were presented to users to test the interface and data presentation formats, ensuring that the visual representations met the users' requirements for clarity and actionability.
Key findings:
- Data overload: Stakeholders were overwhelmed by the sheer volume of data available, which made it difficult to quickly ascertain the status of projects and team performance.
- Customization Needs: There was a clear need for customizable dashboards that could cater to the unique metrics relevant to different roles.
- Accessibility and Integration: Users wanted a tool that would seamlessly integrate with their current workflow in Jira and Confluence without having to toggle between different applications.
- Real-Time Data: A desire for real-time data updates was expressed, enabling stakeholders to make timely decisions based on the latest information.
- Communication Tools: Stakeholders needed ways to easily share insights from data with their teams and across departments to improve collaboration and understanding.
The user research conducted provided the foundation for designing Ada. The insights gained were instrumental in ensuring that Ada would not only be a powerful analytics tool but also one that is user-centric, addressing the specific needs and pain points of its intended users.
Design process
The design process for the Ada analytics tool was centered around creating a user-centric solution that could turn complex data from Jira and Confluence into easily digestible insights for stakeholders. The process was iterative, collaborative, and grounded in the principles of human-centered design.
- Ideation: It began with stakeholder workshops and brainstorming sessions to generate a broad range of ideas and clearly define the problems to be addressed.
- Sketching and wireframing: Early design concepts were visualized through low-fidelity sketches and wireframes, which were refined based on feedback from potential users.
- Prototyping and testing:High-fidelity prototypes were then developed, providing a more accurate representation of the final product, and subjected to several rounds of user testing for feedback and continuous improvement.
- Design Development: The UI/UX design phase solidified the interface and user experience, with a special emphasis on data visualization to ensure information was conveyed effectively.
- Technical architecture: Technical architecture considerations addressed integration with Jira and Confluence and scalability for handling large datasets.
- Implementation and agile development: The Agile development methodology guided the build phase, with prioritization of features ensuring a focused and user-centric final product.
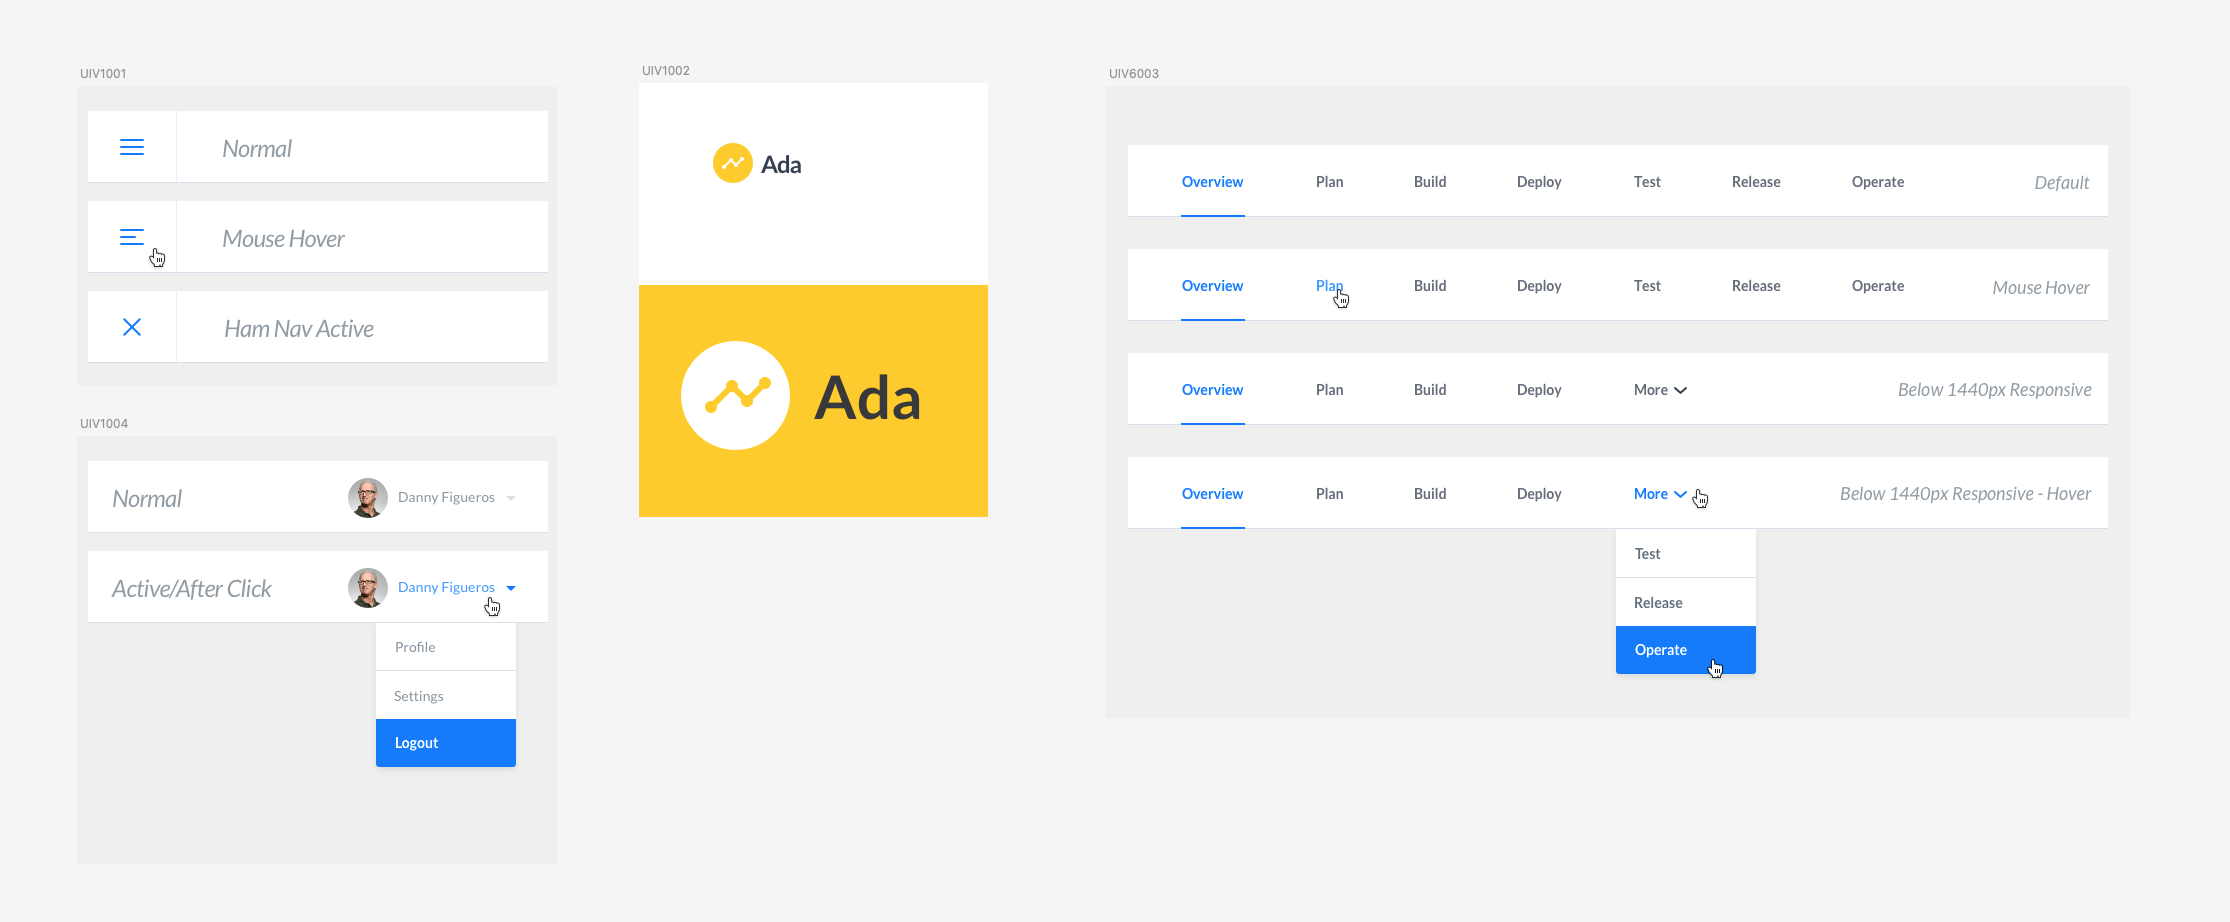
- Design system and style guide: Developed a design system with a style guide to maintain consistency across the application, ensuring that any future updates or expansions would align with the original design ethos.
The entire process was cyclical, allowing for ongoing refinements and adaptations based on stakeholder input and changing requirements.
Results
Upon the successful deployment of Ada, the analytics tool designed to interface with Jira and Confluence, we meticulously tracked a variety of performance metrics to gauge its impact. The results were significantly positive and demonstrated a tangible improvement in the team's productivity and project management efficiency.
- The Ada analytics tool delivered measurable quantitative improvements post-implementation: Sprint velocity and task completion rates increased, indicating heightened productivity. The average issue resolution time was reduced, reflecting more efficient problem-solving. Project delivery times improved, with more consistent adherence to timelines and some projects concluding ahead of schedule. These metrics collectively demonstrate Ada's positive impact on team performance and project management efficiency.
- Qualitative feedback on the Ada analytics tool was highly positive. Stakeholders praised its user-friendliness and the clarity of insights, which bolstered their decision-making confidence. Team leads noted improved strategic decisions due to real-time data access. Additionally, the tool's introduction led to increased team engagement, with members being more invested in understanding how their roles directly influenced team performance and project outcomes.
- The strategic impact of the Ada analytics tool was significant, fostering a proactive, data-driven culture within the teams. It enhanced collaboration by providing a common data framework and improved communication. Strategic resource allocation was optimized as Ada's insights allowed for aligning team skills with project demands, contributing to the overall effectiveness of the development process.
- Operationally, Ada streamlined workflows by integrating analytics within the existing Jira and Confluence environments, reducing context-switching and enhancing efficiency. The tool's predictive analytics capabilities further enabled teams to foresee and mitigate potential issues, optimizing the overall project management lifecycle.
Reflections and learnings
In the Reflections and learnings phase, we gathered that the Ada analytics tool profoundly influenced team dynamics and project management practices. Key learnings included the critical importance of user-centric design in fostering tool adoption and the necessity of flexibility in analytics tools to cater to various stakeholder needs.
The feedback underscored the value of integrating analytics into familiar work platforms, as it minimized resistance to new processes. We also recognized the potential for data analytics to not only report on the past and present but to predict and shape future project trajectories. The iterative development approach, with its continuous feedback loops, proved indispensable in refining the tool to better serve its users. These reflections are vital for guiding future enhancements to Ada and similar tools, ensuring they remain indispensable assets to their users.
Future directions
Looking towards the future, AI integration in tools like Ada offers a myriad of possibilities to further revolutionize team productivity and project management.
Incorporating AI into tools like Ada could enhance predictive analytics, offer personalized recommendations, and improve natural language interactions. AI could tailor user experiences, automate routine tasks, and provide real-time risk assessments, transforming Ada from a mere data visualization tool into an intelligent assistant.
This advancement would promote proactive decision-making, optimize resource allocation, and foster a learning system that continuously adapts to improve team performance and project outcomes.